The 160 m. Propagation Mystery – part 1
Cliccare qui per versione italiana
A and K numbers with West Coast openings
A few days ago, on January 7th, Wolf DF2PY wrote on the Topband Reflector:
…. as this morning yielded very good propagation on the polar routes, it made me wonder why.
The A-index was at 16, the solar wind close to 700 km/s. Normally that is bad news.
We all experienced that the so called reliable magnetic predictors are sometimes out of duty.
But when it happens it surprises still. For some unknown reason, today the beverages beat the phased loops by more than an S-unit. Which is completely out of the ordinary, like the band was today as well.
I am not sure whether Carl has an out of the hand explanation for that. But, if the horse is free, ride on ;-)
73 de wolf - df2py-
The next day we got an explanation by Carl, K9LA:
With respect to Wolf DF2PY's comment about very good propagation on polar routes when the A index and the solar wind speed are elevated, our understanding of what makes 160m thick is lacking. In other words, "stuff happens".
Having said that, there have been similar reports of good propagation on 160m at high latitudes when the K index spikes up. A process that could explain this is tied to changes in the E region and lower F region at elevated K indices. When geomagnetic field activity increases, the atmosphere's electric field (measured in terms of mV/meter) increases. When this happens, the electron density valley above the E region peak can become better developed (deeper and more vertical extent - which would eliminate transits through the absorbing region and eliminate ground reflections).
This process comes from a 1984 paper in the Journal of Geophysical Research. It is only a model - I'm not aware of any measurements to confirm that this happens. So "buyer beware". All I can say is - it makes sense. Carl K9LA
That’s interesting and could modify or add something new to one of the most believed propagation theories saying that high K and A numbers, usually associated with aurora activity, destroy all the high latitude paths.
But, once more, there is something else playing a role in our high latitude paths, mainly to Japan and to the West Coast, and no explanations can be found. Since 25 years I’m keeping regular records and graphs on 160m openings related to solar and geomagnetic data. A lot of stuff can be found in this section: prop.studies---path-analysis.htm
The following is a simple graph with the daily 10.7 cm. solar flux and Ap (planetary) index in the last 30 days. The sun has been totally quiet, without sunspots for a long period, and actually also the geomagnetic field didn’t show great variations: we can’t understand why the band to Japan opened only after December 23 and to the West Coast only on January 4th (N7DD).
In order to find high spikes during this period in the K or A numbers we must look at the single magnetometer stations in the following graph (Thanks to SOLARHAM.com | Solar Cycle 24 | Space Weather and Amateur Radio Website.


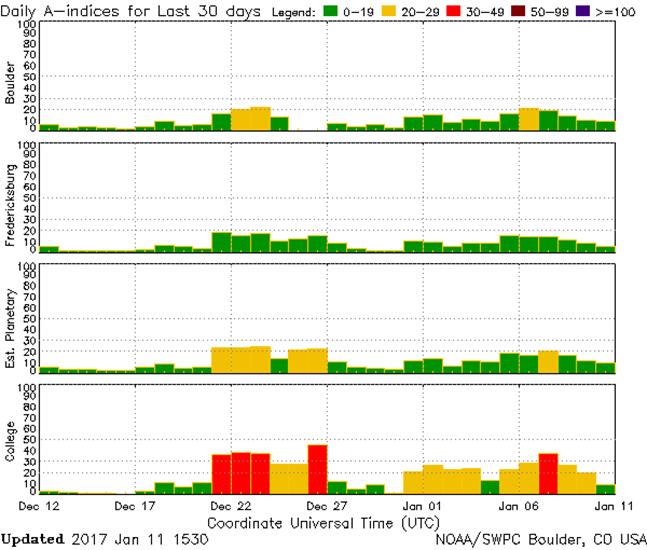
Nothing relevant is shown by Boulder and other mid-latitude stations, but the indexes of College, in Alaska, indicate recurrent geomagnetic activity in the sub-polar area.
But this is not enough to justify the band behavior: between December 20 and 28, conditions to NA have been generally poor, while the days 29, 30 and 31 have been the best to Japan.
In other words, the geomagnetic activity of December 21, 22, 23 and 27 seems to have not produced any increase in the electric field above the E region (with the beneficial effects explained by K9LA), while a similar index on January 7th should had contributed to open a duct through the absorbing region in the artic area, so appreciated by DF2PY.
I am not a “big gun” like Wolf, and on January 7th and 8th I just worked the Central States with CO and AZ, with strong signals. “My day” came on the 9th, with stations worked, from 04 to 07z, in AZ, NV, CA, CO, OR, WA, ND and VE6. The next day I got up at 03z but worked only the central states and the east coast. Even worse on the 11th with no U.S.A. at all. The K3 indexes were exactly the same in all three days. No explanations are given!


Also the magnetometer data coming down from the satellites GOES 13 and GOES 15 do not show any difference in the trend of days 9, 10 and 11 of January.

Further going on with my daily activity I noted the same poor conditions still on January 12th, a small improvement on the 13th (AA0RS), and again a good West Coast opening on the 14th. This happened after four days of very low K numbers also at the magnetometer of College, in Alaska, as shown at the bottom of this graph. Note the difference between 9 and 14 of January, while both days yielded the same good DX conditions. But on Sunday the 15th, with the same low K numbers, the band appeared broken again!

Moral of the story: on 160 meters the DX conditions are unpredictable – generally low numbers are better, but don’t care too much of them – unexpected things happen on this band, and you have to be there when it happens.
The solar cycle decline, cosmic rays and proton flux
After we missed Dr. Brown, NM7M, the maximum authority on 160 m. propagation study is Carl Luetzelschwab, K9LA. On his website k9la.us there is a lot to learn and, with his permission, I extract the following notes from a May 2015 article “What’s Going On with 160-Meters?”, but I suggest its full reading http://k9la.us/May15_What_s_Going_On_with_160-Meters.pdf beside many others.
Confirming what said before, K and A indexes are still the main elements involved in 160Meter propagation. All my graphs include always the solar flux, cosmic rays and the A index through the solar cycles. In the following graph, K9LA reports the monthly number of the days with quiet geomagnetic activity (Ap value of 7 or less) since 1982 to the present. The periods of best DX conditions on 160 meters should correspond to those of low solar activity (minimum of the red curve) and those of low geomagnetic field activity (maximum of the bleu/black curve). At the beginning of year 2015 this was not happening, and Carl wonders why the band conditions were still so poor.

Carl says:
“Note what happened after the solar minimum between Cycle 22 and Cycle 23. The number of quiet days bottomed out (the least amount of quiet days per month) during the decline of Cycle 23 (around January 2004), and then went to an unprecedented number of quiet days during the long solar minimum between Cycles 23 and 24. What’s even more interesting is that the number of quiet days now (spring 2015) still exceeds the number of quiet days during the solar minimum period from 1995-1998.
With so many quiet days now, why isn’t 160-Meters at least as good as in the 1995-1998 period? Two possibilities exist. First, perhaps Ap isn’t a good overall indicator of 160Meter propagation. The Ap index (derived from eight 3-hour K indices) is essentially a mid-latitude measure of the activity of the Earth’s magnetic field. We also have the AE index (Auroral Electrojet), which is a high latitude measure of the activity of the Earth’s magnetic field, and Dst (Disturbance - storm time), which is a low latitude measure of the activity of the Earth’s magnetic field. We’ll look at AE and Dst in a future monthly feature, including the correlation between all three.
Second, could the geomagnetic field be too quiet? Surprisingly, there is a physical basis behind this question. And it involves galactic cosmic rays (GCRs). At solar maximum, the Sun is more active, causing more geomagnetic field activity that is believed to be detrimental to 160-Meter propagation. Coupled with the Sun being more active is the fact that the Sun’s magnetic field is stronger, which shields the Earth from galactic cosmic rays. Going the other way, when we are at solar minimum the Sun’s magnetic field is weakest, letting in more cosmic rays.
Now cosmic rays are mostly high energy protons generated outside our solar system. They hit the top of our atmosphere causing secondary particles to rain down on us. These secondary particles could cause additional ionization down low in the atmosphere.
And additional ionization in the lower atmosphere – layer D – causes more absorption of our signals passing through”.
The next graph, taken from the Moscow Neutron Monitor site, shows the cosmic rays variations (% decrease) from 1981 to the present. We see how even during the maximum of the last cycle 24 the cosmic radiations did not decrease, thus contributing to a general increase of the low atmosphere ionization.

Now let’s go back for a while to the previous issue, regarding the changed conditions from January 9th to 11th. Aside from the geomagnetic field and the stable solar flux, could had been any other variation in the ionosphere?
These are the hourly cosmic rays’ variation picked up by the Moscow Monitor in those three days:

And this is the consequent flat Proton Flux registered by GOES 13 satellite:

Definitely the Proton Flux seems to have no influence on propagation variations and let me conclude this part with Carl’s sentence:
In summary, we’ve looked at a lot of stuff. On one hand, we should have good 160-Meter conditions because the Earth’s magnetic field appears to be very quiet. On the other hand, we may be experiencing more absorption that makes 160-Meters worse because the Sun’s magnetic field appears to be letting in more GCRs that cause more absorption. The only sure thing I can say is the best thing to do is be on 160-Meters as much as you can to catch those short openings for which 160-Meters is known. Carl, K9LA
January 15, 2017 – Luis IV3PRK