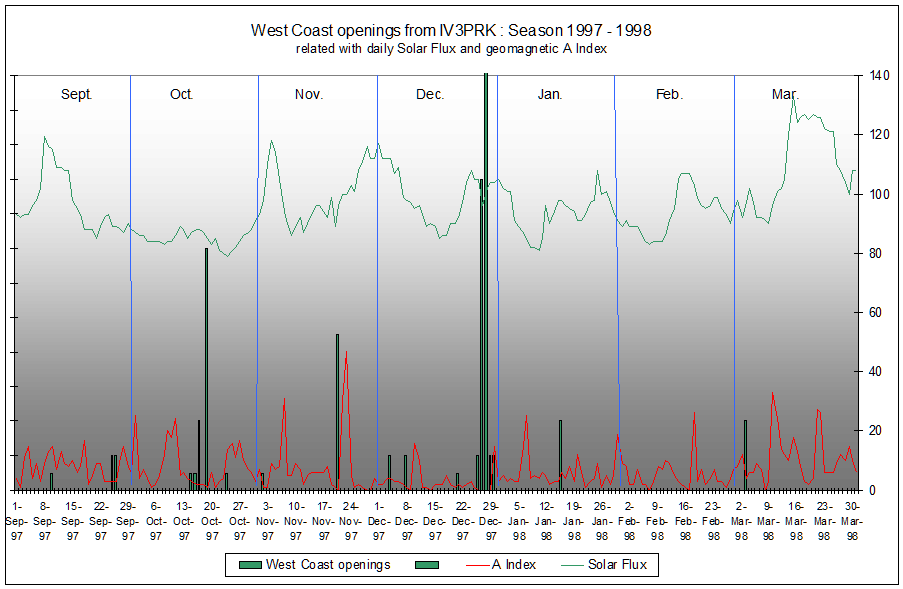
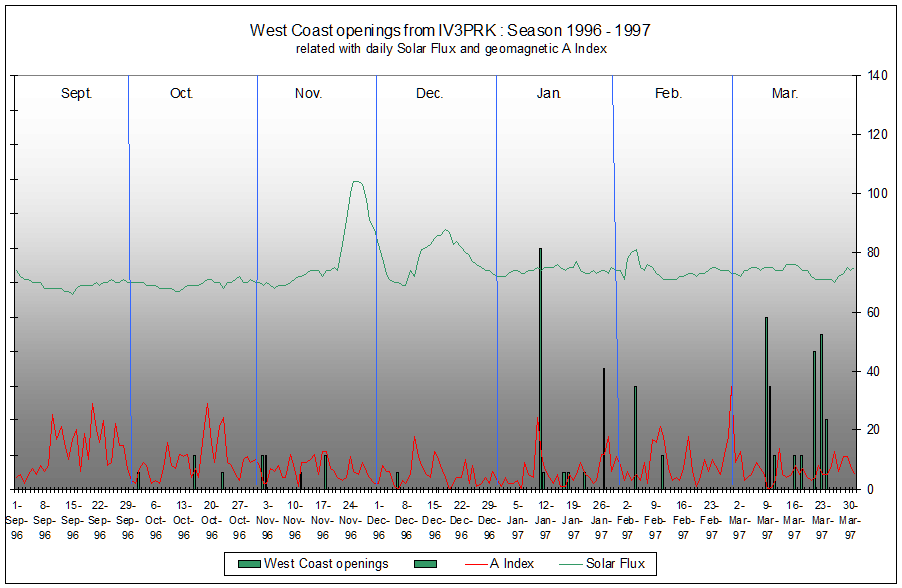
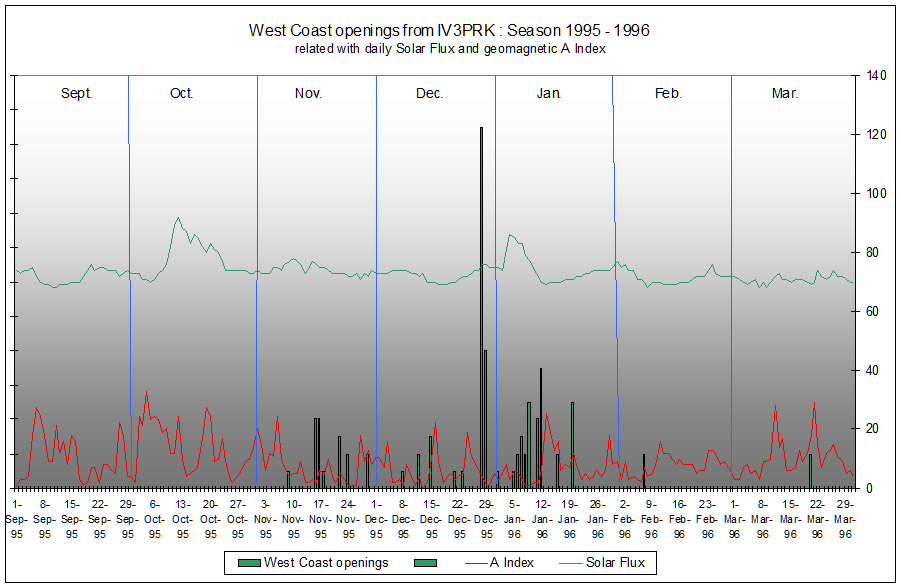
QSOs with the West Coast have been always the most thrilling, also on the higher bands, and on Topband they are my main target.
I am collecting U.S.Counties and already managed to get the first USA-CA award on 160 meters from outside North America. But there are still so many to work, specially in the central and western States, and this will keep me busy forever!
This is generally an high latitude path, going through the aurora polar cap, severally affected by geomagnetic conditions and I keep a separate dedicated data base for these openings. This is a graph summarizing them, for groups of States and for each winter season.
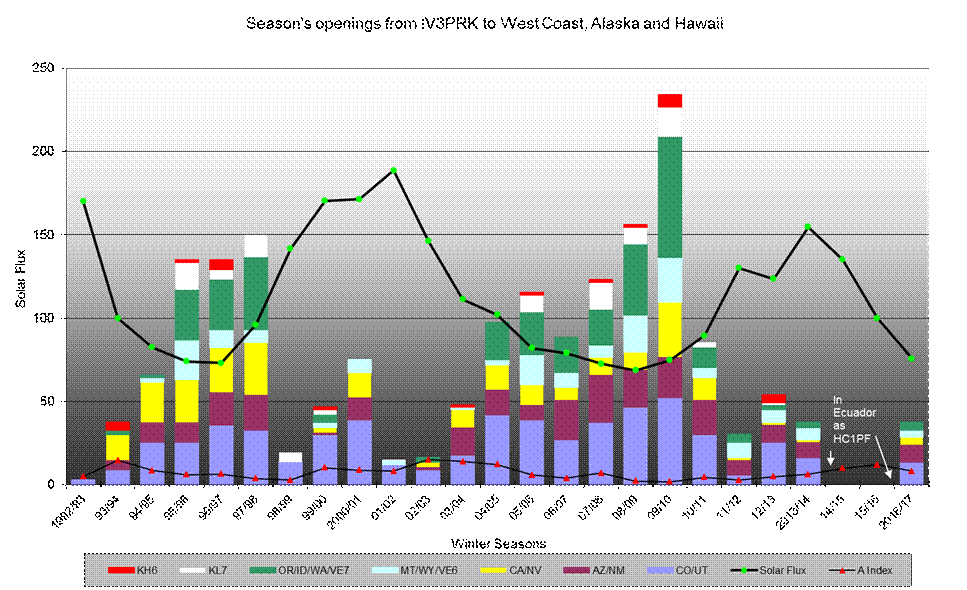
No doubt that the propagation conditions have been improving during the last solar cycle minimum, but they were expected to be much and much better. Considering that I got my retirement in July 2004, with much more time dedicated to the band since then (specially at sunrise time), my judgment is that the previous sunspot minimum (Cycle 22) had been better as far as the West Coast path is concerned, despite the very low and stable geomagnetic numbers.
Furthermore prop. conditions with West Coast roughly collapsed in the year 2010 to confirm NO correlation with the numbers!
The following graphs show the number of QSO’s with California and Washington state/Vancouver, the toughest paths from Europe, but both areas with many regularly active and well equipped stations. These graphs do not show the same growing as the previous one, because most of the openings are given by the same big guns already worked many times…..
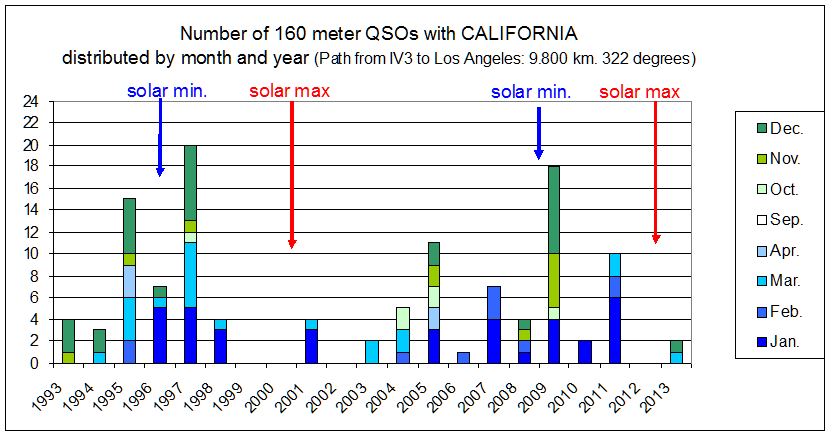
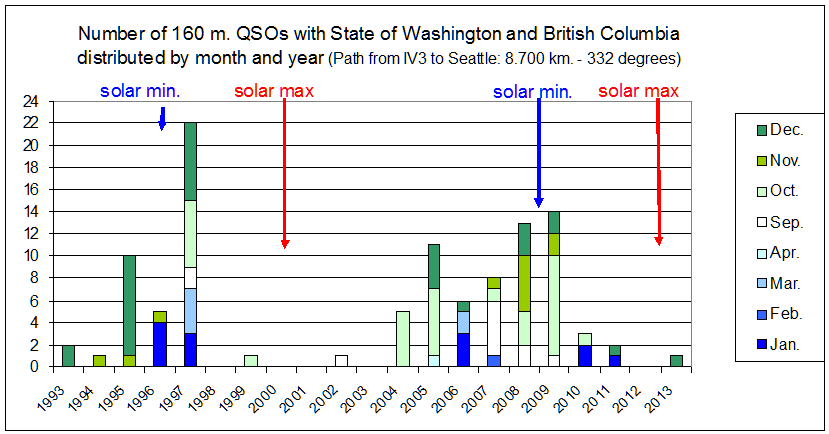
It should also be explained why the best months for California are generally from January to March, while for Washington and VE7 they are from September to December! (but only N7UA worked in the seasons 2010 and 2011…and not even him in 2012/2013 !)
In any case, why such a difference between the behaviour of these paths, 30/40 degrees West of North, and the similar one to Japan, 40 degrees East of North? See here for a comparison. OK, we should relate to the Magnetic and not the Geographic Pole, but it has been a long period without any geomagnetic disturbance!
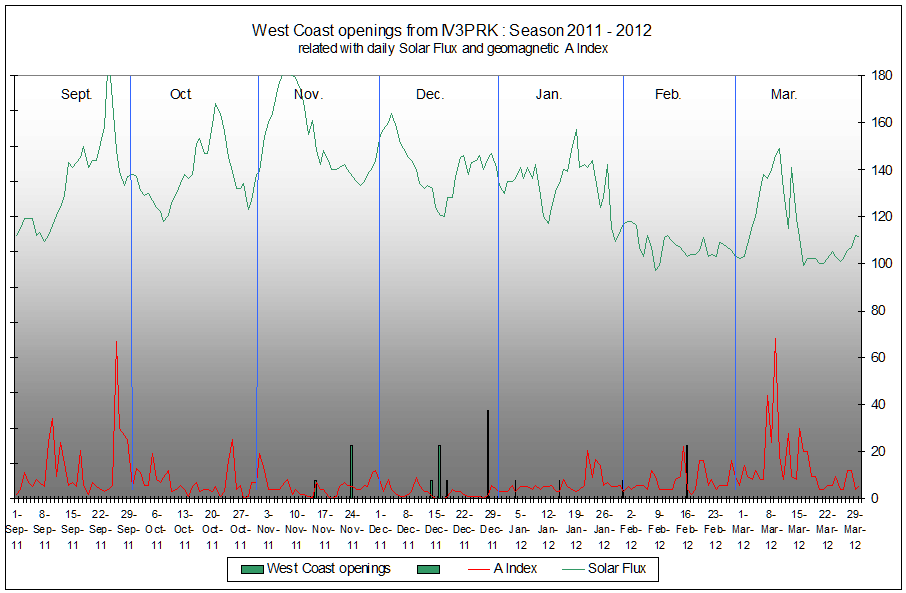
Finally I built the following graphs where the cumulative West Coast openings are indicated for each day, in order to find the correlation between them and the daily Solar Flux and A Index variations. Once again, despite the regular activity on both sides, it seems difficult to see such correlation!
This is the current season: almost nothing until December, and quite few really from the West Coast: just one QSO with California and nobody for the second year with WA or VE7.
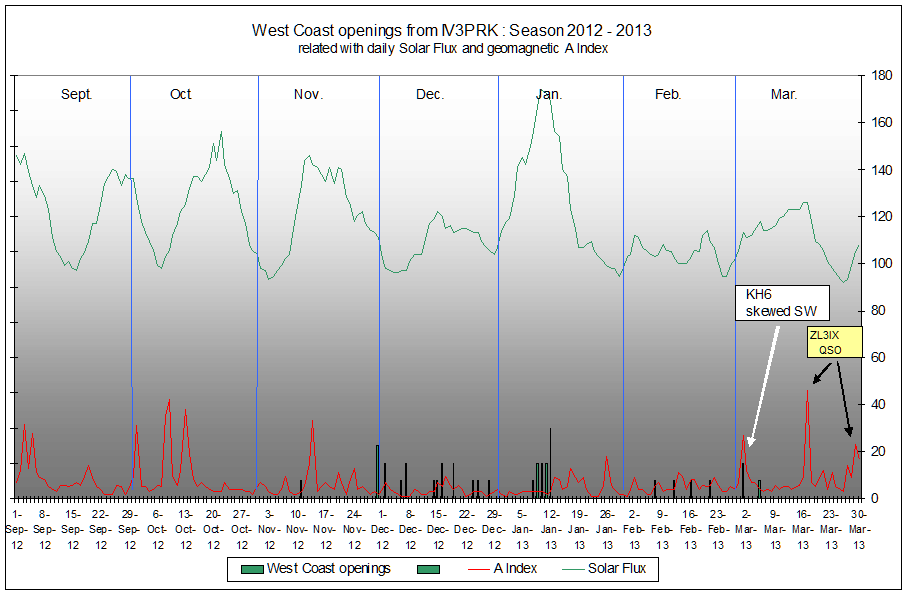
Interesting to note the good opening we got with Hawaii on March 1st with high A index over a path skewed to South West. To confirm that disturbed geomagnetic conditions have a negative effect only on the northern paths, give a look at the ZL3IX QSO’s (18.000 km) on March 17 (K index = 6) and 29 (K index = 5) !
The following was the graph of the previous season, even worse … hopefully the worst of the cycle !
The next shows season 2010-2011, with very few and weak openings (that means one or two stations, only the big ones like N6TR, N7DD, N7UA, N7JW, K0RF, K9BWI….) until the end of December. Anyway in January the propagation did somehow recover; four openings from Jan. 8th to 15th and a few QSO’s with California also in February and March (much better than the previous year), despite the increasing solar activity …why have been so poor the last months of 2010 ?
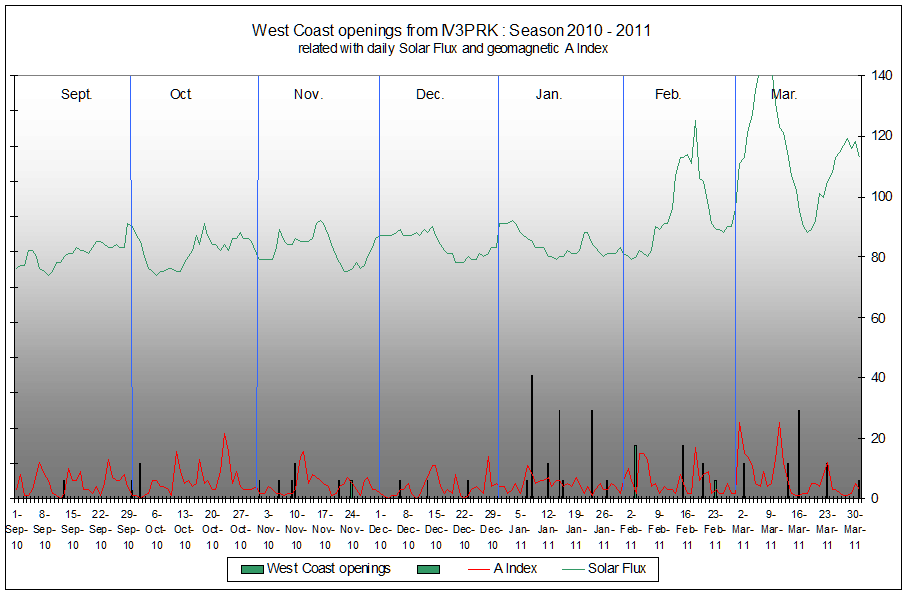
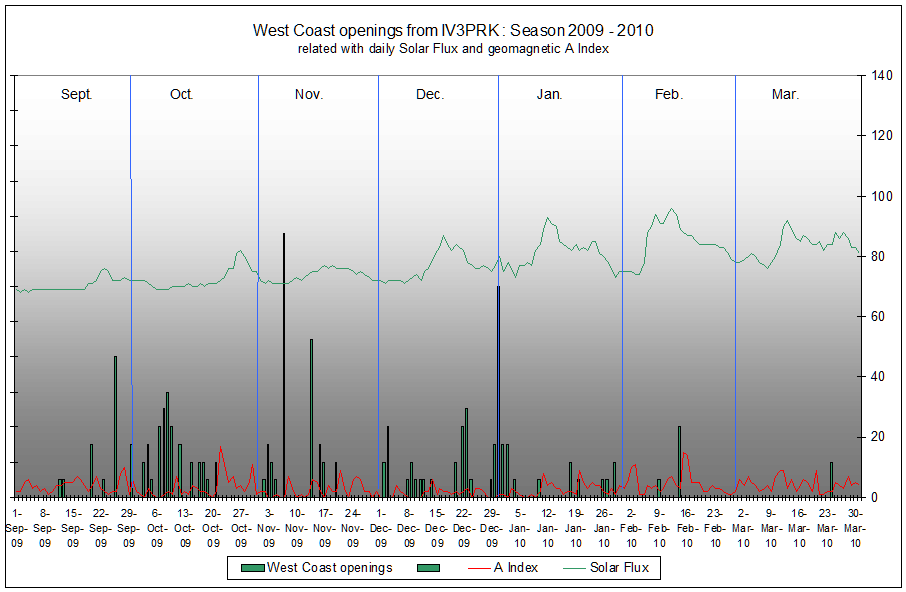
The next 3 graphs show the previous best seasons of the last cycle. Note what a difference between the same months from one year -2009- below, to the next one -2010-, above …under the same A Index and Solar Flux lines !
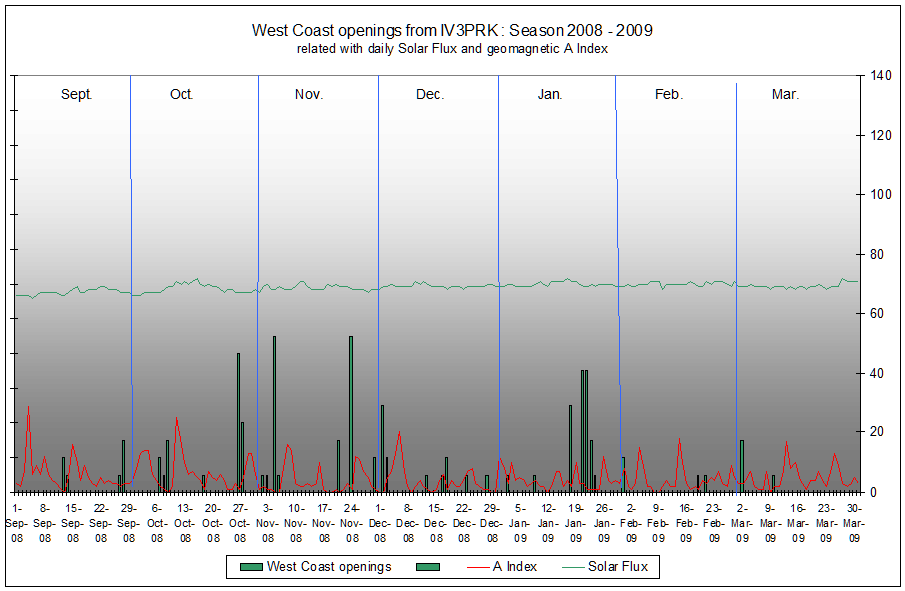
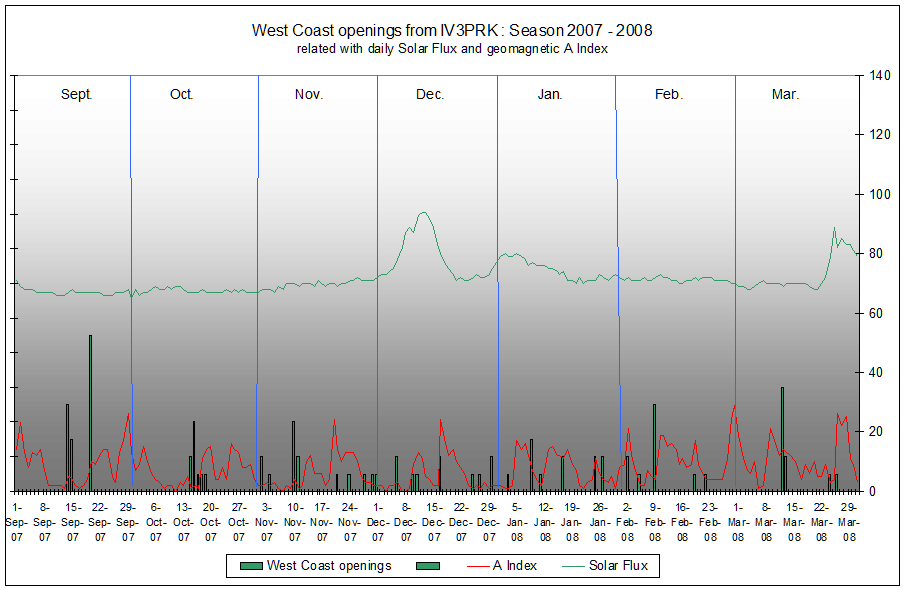
The next are related to the best 3 seasons of the previous solar minimum, 11 years before, for comparison:
